Structure-Based Prediction of Autophagy Modulators: From Transcriptome Collapse to Binary Classifiers
Abstract
Autophagy is an attractive but difficult target for computational screening because the observable signal sits several steps downstream of small-molecule structure, and transcriptomic readouts often mix pathway-specific biology with generic stress response. This report benchmarks multiple formulations of the problem, including full transcriptome regression, context-aware binary classification, structure-only binary classification, and activator-versus-inhibitor direction prediction.
The first major result was negative. A Uni-Mol-based transcriptome model collapsed on biological controls, predicting Rapamycin and Wortmannin with Spearman correlation of ρ = +0.97 across 12,328 genes, which is visible as an almost perfect y = x scatter in Figure 1. That behavior is incompatible with a model that is meaningfully separating opposing autophagy biology.
The most useful result came from reframing the task. In the final ROC comparison, the strongest context-aware binary model was Morgan + context at AUROC 0.845, while the strongest displayed overall binary model was structure-only XGBoost with Morgan + CLAMP at AUROC 0.895. External scoring on ChEMBL also favored Morgan + CLAMP over Morgan only across all displayed thresholds in Figure 3.
Direction prediction remained weak. Figure 4 shows that the flat 3-class models reached 0.900 accuracy but only 0.532 and 0.455 macro F1, indicating that headline accuracy was largely driven by the dominant neutral class rather than robust inhibitor discrimination. The main conclusion is therefore narrow but defensible: binary autophagy-modulator classification is tractable, while transcriptome regression and activator-versus-inhibitor direction prediction remain unreliable with the current public data stack.
1. Introduction
Autophagy is a conserved degradation and recycling program with relevance to aging, neurodegeneration, cancer, and stress adaptation. The practical drug-discovery question is not only whether a molecule perturbs transcription, but whether it modulates autophagy in a way that is biologically actionable.
A natural first idea is to learn a structure-to-transcriptome map, then derive autophagy activity from the predicted expression profile. That framing is attractive because LINCS L1000 provides large-scale perturbational transcriptomics, and public databases such as HAMDB provide curated autophagy labels. It is also risky, because transcriptomic state is shaped by cell type, dose, time, batch effects, pathway cross-talk, and stress programs that may have little to do with true autophagic flux.
The project described here was designed as a stress test of that idea. The core question was whether chemical structure could support reliable autophagy prediction, and if so, which formulation of the task actually generalized: full transcriptome regression, signature matching, binary modulator classification, or direction prediction.
2. Data and Modeling Setup
2.1 Data Resources
The project used LINCS L1000 as the perturbational backbone, HAMDB as the primary autophagy label source, and ChEMBL as an external scoring environment for enrichment analysis.
| Resource | Scope | Role in Study |
|---|---|---|
| LINCS L1000 Phase I | 471,660 Level 5 signatures; 20,315 compounds; 76 cell lines | Transcriptome prediction, context-aware classification, held-out biological validation |
| HAMDB | 841 unique compounds with SMILES; 514 activators, 132 inhibitors, 167 neutral after curation | Positive labels and direction labels |
| Autophagy Gene Sets | Broad 199-gene set and stricter core sets derived from ATG machinery, lysosomal genes, and mTOR readouts | Regression targets and signature analyses |
| ChEMBL Screen | 99,434 neutral small-molecule structures as negatives | Out-of-training prioritization and annotation enrichment |
2.2 Representations and Model Families
Three molecular representations were used across the project: Morgan fingerprints (2,048-bit circular fingerprints), CLAMP (a 768-dimensional molecule-bioassay embedding), and Uni-Mol (a 512-dimensional representation for the early transcriptome-regression experiments).
The models fell into four families:
- Transcriptome Regression: Neural networks trained to predict continuous 12,328-gene or 199-gene outputs from molecular embeddings.
- Context-Aware Binary Classifiers: Models using molecular features + experimental context (cell type, dose, time) to classify modulators.
- Structure-Only Classifiers: XGBoost classifiers trained strictly on chemical fingerprints without biological context.
- Direction Predictors: Multi-class and cascaded models attempting to separate activators, inhibitors, and neutrals.
2.3 Evaluation Logic
The evaluation strategy prioritized biologically meaningful validation rather than relying only on aggregate statistical metrics. Scaffold-aware splits (Murcko scaffold-family OOD splits) were used to reduce trivial chemical leakage. Canonical controls like Rapamycin and Chloroquine were held out to test biological generalization. External scoring on ChEMBL served to measure enrichment rates in real-world bioactivity assays.
3. Results
3.1 Transcriptome Regression Collapsed on Controls
The earliest serious warning sign came from the audit of the Uni-Mol-based neural network model (trained on 2,000 compounds). When predicting transcriptomic changes, we ran biological controls using Rapamycin (canonical autophagy inducer) and Wortmannin (PI3K inhibitor blocking autophagy).
These two drugs should produce anti-correlated profiles. Instead, the model predicted them with a Spearman correlation of ρ = +0.97. This behavior is visible in the scatter plot below, showing the model learned to output a near-identical "mean stress" vector for all compounds, failing to separate opposing autophagy biology.
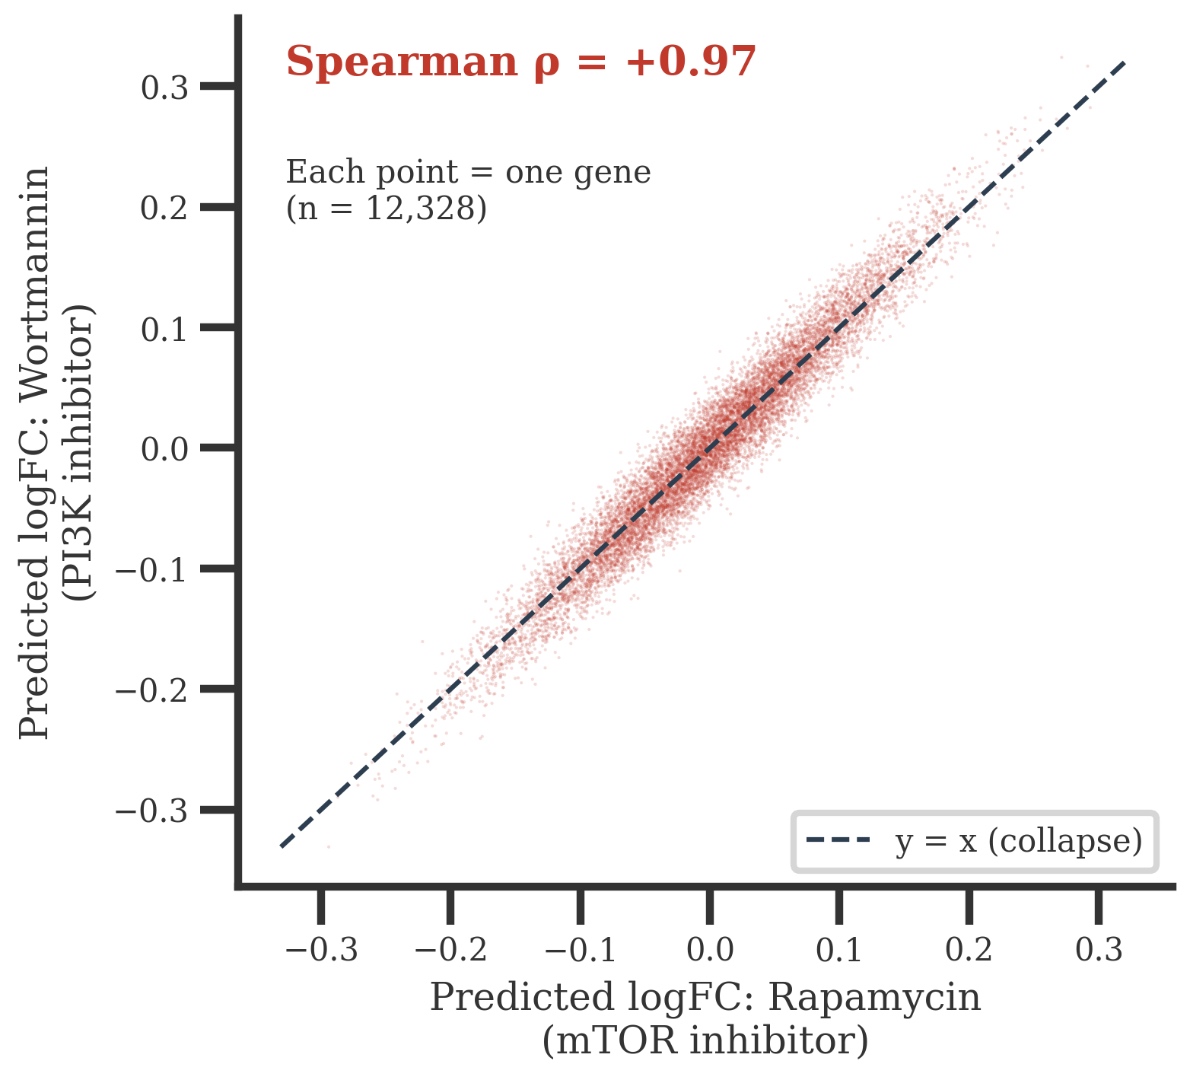
Figure 1. V6 transcriptome collapse on biological controls. Predicted logFC for Rapamycin and Wortmannin are nearly identical across 12,328 genes (ρ = +0.97).
3.2 Binary Classification Outperformed Transcriptome Prediction
Once the task was reframed from regressing 199 continuous gene expressions to binary modulator classification (modulator vs. non-modulator), performance became much more credible. Scaffold-aware validation and held-out controls both validated successfully.
| Model | Feature Set | Setting | AUROC | Interpretation |
|---|---|---|---|---|
| Ridge + context | CLAMP + context | Context-aware | 0.722 | Linear baseline for CLAMP |
| Ridge + context | Morgan + context | Context-aware | 0.823 | Linear baseline for Morgan |
| MLP + context | CLAMP + context | Context-aware | 0.800 | Non-linear CLAMP model |
| MLP + context | Morgan + context | Context-aware | 0.845 | Best context-aware classifier |
| XGBoost | Morgan only | Structure-only | 0.879 | Structure-only baseline |
| XGBoost | Morgan + CLAMP | Structure-only | 0.895 | Best overall model |
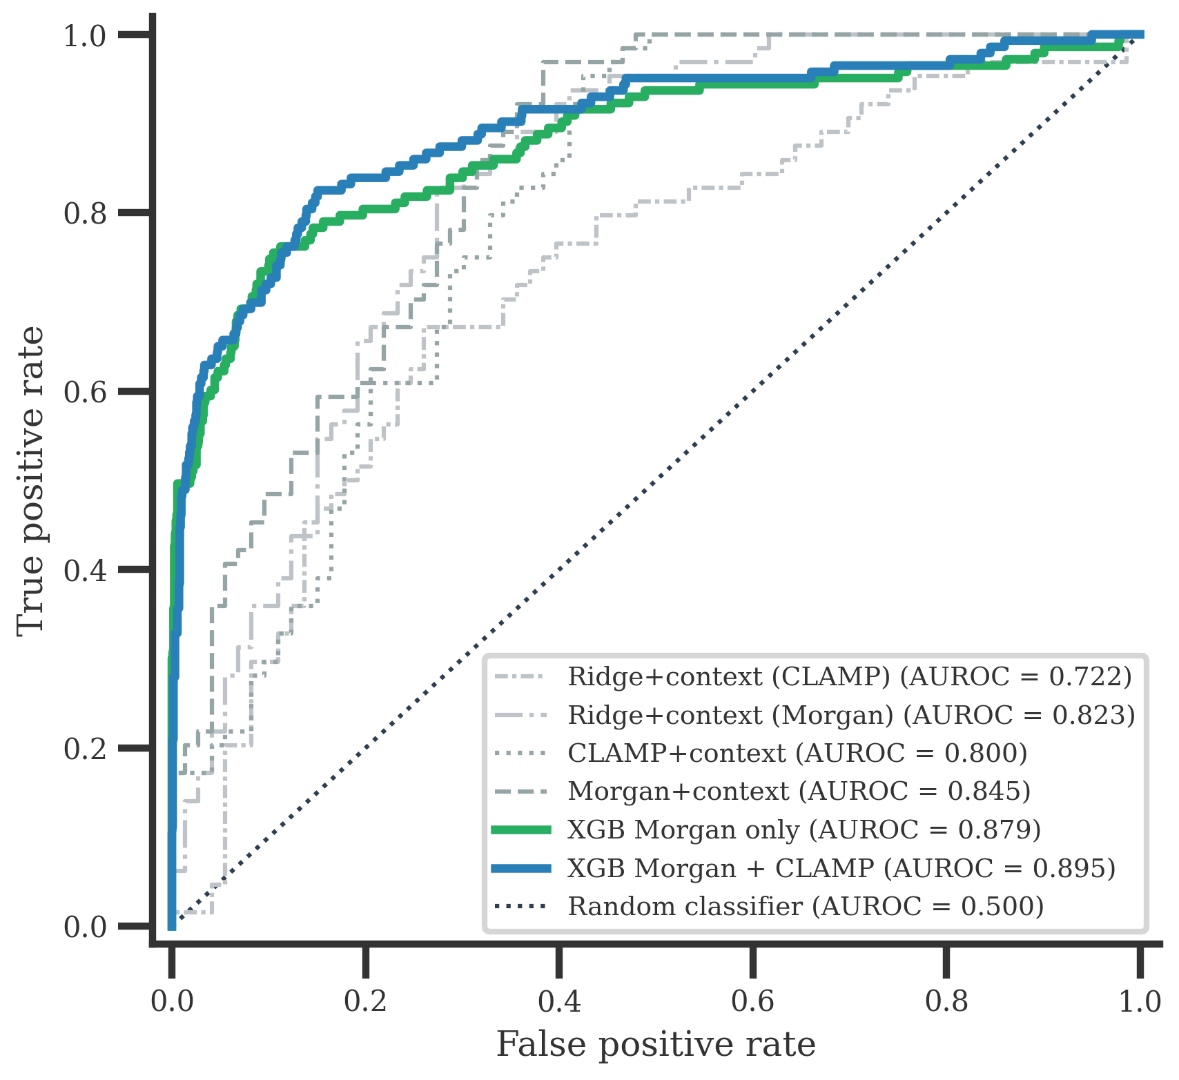
Figure 2. Binary modulator classification ROC curves. Morgan fingerprints consistently outperform CLAMP in context settings, while Morgan + CLAMP yields the best overall structure-only classifier (AUROC = 0.895).
To test how these models generalize to larger chemical spaces, we screened 99,434 neutral small molecules in ChEMBL and measured how frequently top predictions hit validated orthogonal autophagy assays.
| Score Threshold | N Compounds | % of ChEMBL | Autophagy-Active % | mTOR/PI3K % | Enrichment Factor |
|---|---|---|---|---|---|
| ≥ 0.50 | 21,897 | 22.0% | 0.40% | 0.51% | 1.0× |
| ≥ 0.70 | 9,201 | 9.3% | 0.52% | 0.79% | 1.6× |
| ≥ 0.90 | 980 | 1.0% | 1.02% | 2.55% | 5.2× |
| ≥ 0.95 | 310 | 0.31% | 1.61% | 3.23% | 9.0× |
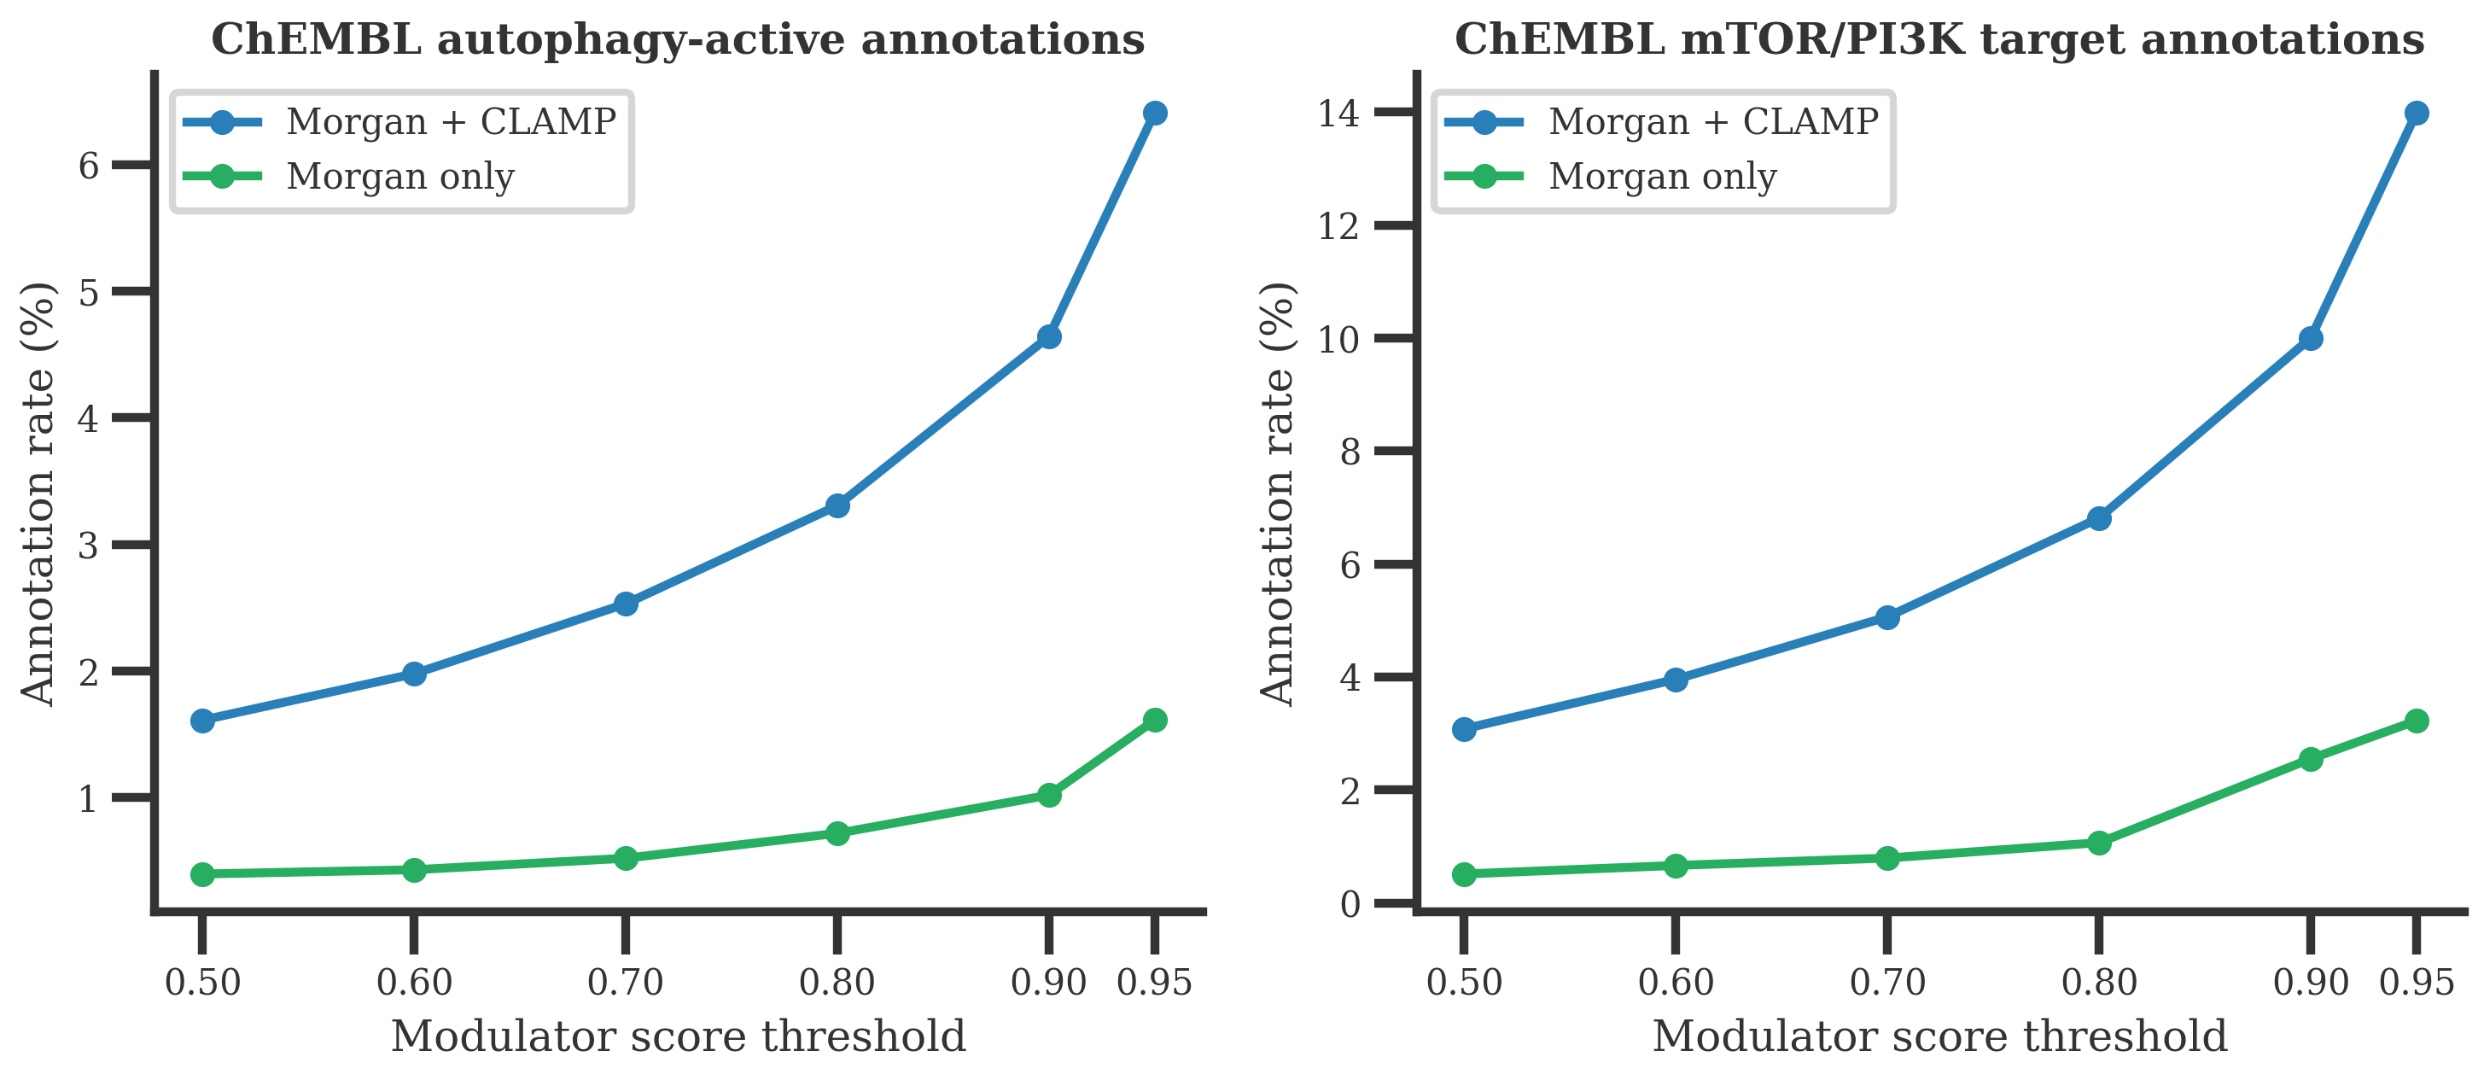
Figure 3. ChEMBL validation and annotation enrichment. At high score thresholds, the Morgan + CLAMP model achieves a 3-9× enrichment for annotated autophagy-active and mTOR/PI3K target compounds over the baseline ChEMBL set.
3.3 Direction Prediction Remained Weak
Although the binary classifier succeeded, structure-based direction prediction (separating activators from inhibitors) hit a hard ceiling.
We tested both flat 3-class models and cascaded binary-to-direction classifiers using scaffold-aware cross-validation. Flat 3-class models reached a headline accuracy of 0.900, but only 0.532 and 0.455 macro F1 (Figure 4). The high accuracy was an artifact of the dominant neutral class; the model struggled to differentiate active enhancers from active blockers. Feature ablation showed RDKit 2D descriptors added no signal, and balanced sampling helped only modestly (AUROC ~0.59).
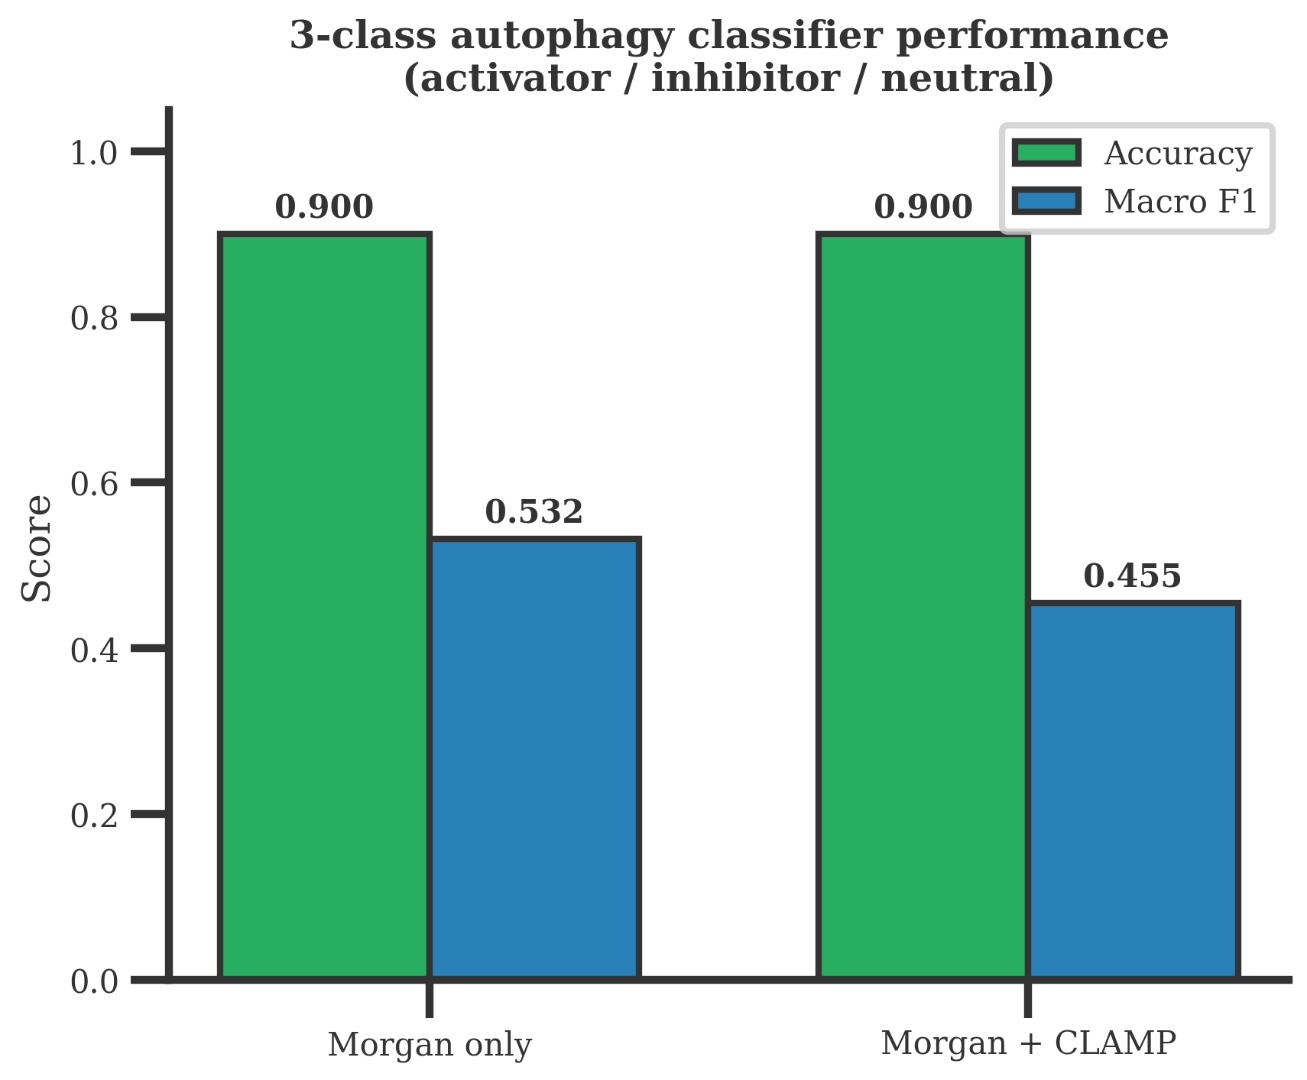
Figure 4. 3-class autophagy classifier performance. High classification accuracy (0.90) is driven by the majority neutral class. The low macro F1 scores (0.532 and 0.455) indicate poor performance in distinguishing activators from inhibitors.
3.4 Transcriptomic Signature Matching and Flux Signatures
We explored whether transcriptomic signature matching (inverse search) could bypass direct model prediction. We computed the mean L1000 transcriptomic signature for known HAMDB activators and inhibitors, then correlated all LINCS compounds against them to discover candidates.
Initially, the broad 199-gene signature matching yielded ~12% HAMDB activator enrichment in the top 50 hits, identifying compounds like GSK-2126458, fluvastatin, and ivermectin. However, diagnostic checks revealed that the mean activator signature had a high correlation (~0.71) with random non-HAMDB compounds. The signature was capturing a generic cellular stress response rather than specific autophagy activation.
To resolve this, we built a stricter pipeline (Experiment 7) utilizing a 70-gene core set, per-cell-line contrastive subtraction, and scaffold-aware splits. We also constructed a flux-informed signature (Experiment 8) based on 25 genes that move in opposite directions under activation vs. blockage.
Although these revisions improved internal cross-validation consistency in some cell lines (BT20, MCF10A, VCAP), **the enrichment of known HAMDB activators collapsed to ~2%–2.5%**. The rigorous pipeline stripped out the generic stress signal, leaving a weak, highly context-dependent transcriptomic trace. Validation against ChEMBL verified that only 5 of the top 200 flux-informed signature hits had autophagy-relevant activity annotations—all of which were PI3K/mTOR kinase inhibitors.
4. Discussion & Limitations
Predicting high-dimensional transcriptomic profiles from 2D chemical structure is intrinsically difficult due to:
- Indirect Causal Chain: Molecular binding to a target is separated from transcription by complex signal-transduction pathways, chromatin dynamics, and translational feedback.
- Confounding Stress Signals: The transcriptional response to pathway activation is frequently masked by generic stress-response programs.
- Many-to-One Mapping: Autophagic flux blockers (e.g. lysosomes inhibitors like Chloroquine) trigger transcription factor activation (TFEB/TFE3) to clear blockages, making their mRNA signatures resemble those of autophagy activators.
- Context Confounders: Batch effects, cell-line specificity, dose kinetics, and timepoints dominate the raw transcriptomic signal.
Our study is bound by several technical limitations:
- Data Sparsity: The curated HAMDB database contains only 132 inhibitors with valid scaffolds, which is insufficient for structure-based direction classification.
- ChEMBL Assay Sparsity: Autophagy-specific assay coverage is low in ChEMBL (only 0.18% of evaluated structures), making external validation stats noisy.
5. Conclusions & Next Steps
The key conclusions are:
- L1000 mRNA profiles are an imperfect proxy for autophagic flux. Due to transcriptomic overlap between blockage and activation, transcriptome regression remains weak.
- Simple chemical representations are highly competitive. For modulator classification, Morgan fingerprints significantly outperform learned embeddings like CLAMP.
- Binary classification is tractable. Training classifiers directly on curated labels (like HAMDB) vs. neutral backgrounds reaches AUROC 0.858 and achieves a 9× enrichment for active molecules at high score thresholds.
Future computational longevity work should:
- Ignore direction predictions: Avoid using multi-class direction models for compound prioritization until larger inhibitor databases are compiled.
- Integrate direct flux endpoints: Train models directly on physical assays (like LC3-II turnover or SQSTM1 degradation rates) rather than using transcriptomes as an intermediary.
6. Reproducibility & Repository Structure
All scripts and datasets are committed in the workspace repository:
| File Name | Purpose |
|---|---|
| curate_autophagy_genes.py | Extracts 199-gene autophagy target network from KEGG pathways. |
| generate_clamp_embeddings.py | Generates 768-d contrastive embeddings on the L1000 library. |
| hamdb_binary_classifier_xgb.py | Trains XGBoost binary modulator classifier comparing CLAMP and Morgan. |
| curate_hamdb_directions.py | Curation script to classify modulators into activators and inhibitors. |
| extract_autophagy_signatures_v2.py | Generates background-subtracted cell-line contrastive signatures. |
| flux_informed_signature_and_assay_integration.py | Evaluates the 25 flux-informed genes and queries ChEMBL assay database. |
| binary_morgan_only_xgb.pkl | Trained, serialization-ready XGBoost binary classifier (AUROC = 0.858). |
| cascade_autophagy_classifier.py | Two-stage cascade classifier script combining binary and direction models. |