Interactive single-cell aging atlas

Conserved Aging Explorer

Finding: within mouse; cross-species conservation not established

We searched every cell type in the aging mouse atlas for genes that change with age. Only 17 of 163 cell-type units met the eligibility floor; 14 show aging-associated differential expression, all in lung and kidney. The catalog contains 261 direction-specific gene entries across 257 unique genes, with limited overlap among significant lists. In human analyses of 621 public donors and a 284-donor lifespan atlas, whole-cohort summaries provide no supported evidence of a rise. This page presents the evidence, its statistical limits, and designs that could improve inference.

163 units evaluated 14 of 17 eligible show aging 261 entries, 257 unique genes 905 human donors scored
Read the story

The story in 30 seconds

  1. 1 Where can aging even be measured? Only 17 of 163 mouse cell-type units met the eligibility floor. All 17 are in lung and kidney, but meeting the floor does not establish adequate power.
  2. 2 Is the signal real? The top unit shows 55 aging-associated genes against a mean of 4.6 in five permutations, and its effect estimates agree with the published atlas. The small permutation check is supportive, not precise calibration.
  3. 3 What is the aging signature? The catalog has 261 direction-specific entries across 257 unique genes. Significant lists overlap little, but that alone does not prove cell-type-private biology.
  4. 4 Does it hold across species? Mouse scores rise in a partly in-sample analysis. Five naked mole-rats cannot establish either change or stability. Human whole-cohort summaries show no supported rise, while cell-type estimates vary by cohort and normalization.
  5. 5 What would improve human inference? More donors with broader age coverage can reduce detectable-effect sizes, but the illustrative grid does not guarantee power or prescribe a design that works. The 284-donor lifespan atlas provides a complementary analysis.
Chapter 1

Of 163 tissue-cell-type units, 17 are eligible and 14 show aging, all in lung and kidney.

“Eligible” means at least 3 mice and at least 50 cells in both the young and old groups. This analysis floor is not evidence of adequate statistical power.

Only 2 of 16 tissues contain units eligible for this analysis

Of 163 tissue by cell-type units evaluated, 17 met the pre-registered mouse eligibility floor of at least 3 mice and at least 50 cells per group for the 3 month vs 18 month contrast. All 17 are in lung or kidney. The other 146 units, spread across the other 14 tissues, did not meet the floor, so this atlas cannot support an aging call for them. Meeting the floor permits analysis but does not establish adequate power. Solid tiles: eligible units. Hollow tiles: ineligible, so no aging call is made.

Why so few? The sex by age design constraint

The eligibility floor was pre-registered as a minimum analysis requirement, not a power calculation. In the 10x Chromium droplet arm of Tabula Muris Senis, only 17 units have at least 3 mice and at least 50 cells per group for the 3 month vs 18 month contrast.

3-month mice: 5 male, 2 female. 18-month mice: 2 male, 2 female. The 21-month group is female-only; 1-month, 24-month, and 30-month are male-only. The 3m vs 18m contrast is the only age comparison with both-sex replication in both groups.

Lung adventitial cells and kidney tubule cells exhibit strongest aging signals

Differentially expressed genes (FDR < 0.05) per unit, ranked. Rank 1: Lung, adventitial cell (55 genes); Rank 2: Kidney, proximal convoluted tubule epithelial cell (53). Three eligible units show no aging genes and appear as zero bars. Tap any bar to inspect unit details.

Chapter 2

Top signal is 12x its five-permutation mean, and pipeline agrees with the original paper.

Three checks before interpreting the numbers: compare with shuffled labels, compare with published estimates, and examine the relationship with cell maturation.

Pipeline direction matches the published atlas in 13 of 17 units (4 partial, 0 disagree)

Agreement with the TMS paper's published age coefficients across the 17 eligible units: 13 agree, 4 partial, 0 disagree. The strongest agreement is in kidney proximal convoluted tubule: Spearman rho 0.866 over 13,019 shared genes, with sign concordance 0.977 among the paper's significant genes. For 15 of 17 units the comparison is between our dichotomous 3 month vs 18 month effects and the paper's continuous-age coefficients; a continuous-age bridge model was fit for 2 units, and the agreement table states which comparator applies per unit.

Agreement status across all 17 eligible units: 13 agree, 4 partial, 0 disagree

Calibration check: 55 age-differentially expressed genes observed versus a mean of 4.6 across five permutations

Observed in the top unit (lung adventitial cell), 3 month vs 18 month: 55 age-differentially expressed genes. Five label permutations give a mean null count of 4.6, a coarse comparison rather than a precise null estimate. The within-3-month sex comparison (2 female vs 5 male mice) finds 0 genes at FDR < 0.05, but this small comparison does not rule out sex effects or establish that the aging signal is independent of sex.

Statistical guards: Permutation null, sex-confound caveat, and trajectory check

0. Sex by age (partial): 1-month, 24-month, and 30-month groups are male-only and the 21-month group is female-only, so sex and age cannot be separated across the full design (G4). The 3m vs 18m contrast has both sexes in both arms (5 male + 2 female vs 2 male + 2 female), and the primary model adjusts for sex. The within-3-month sex comparison finds no significant genes in this unit, but cannot exclude sex effects. Aging calls on this page remain conditional on the TMS design.

1. Positive-Control Marker Panel (Top Unit — Lung adventitial cell): Canonical aging markers from results/m2-calibration-positive-controls.csv: Apoe +0.099 (p=0.630), Il6 +0.778 (p=0.267), Lgals3 +0.467 (p=0.344), and Igfbp3 -0.905 (p=0.312). None of the four reaches nominal significance. As stated in report limitation 17, the calibration claim rests on the permutation null (exact p=0.111 / 0.133, null mean 4.6 vs 55 observed) and the sex floor (0 DE genes), not on marker recovery.

2. Differentiation Guard (G5): Guard check, Marrow: diffusion pseudotime vs chronological age, Spearman rho 0.016. This check finds no association in that analysis, but does not exclude every possible maturation effect. No trajectory-based aging claim is made.
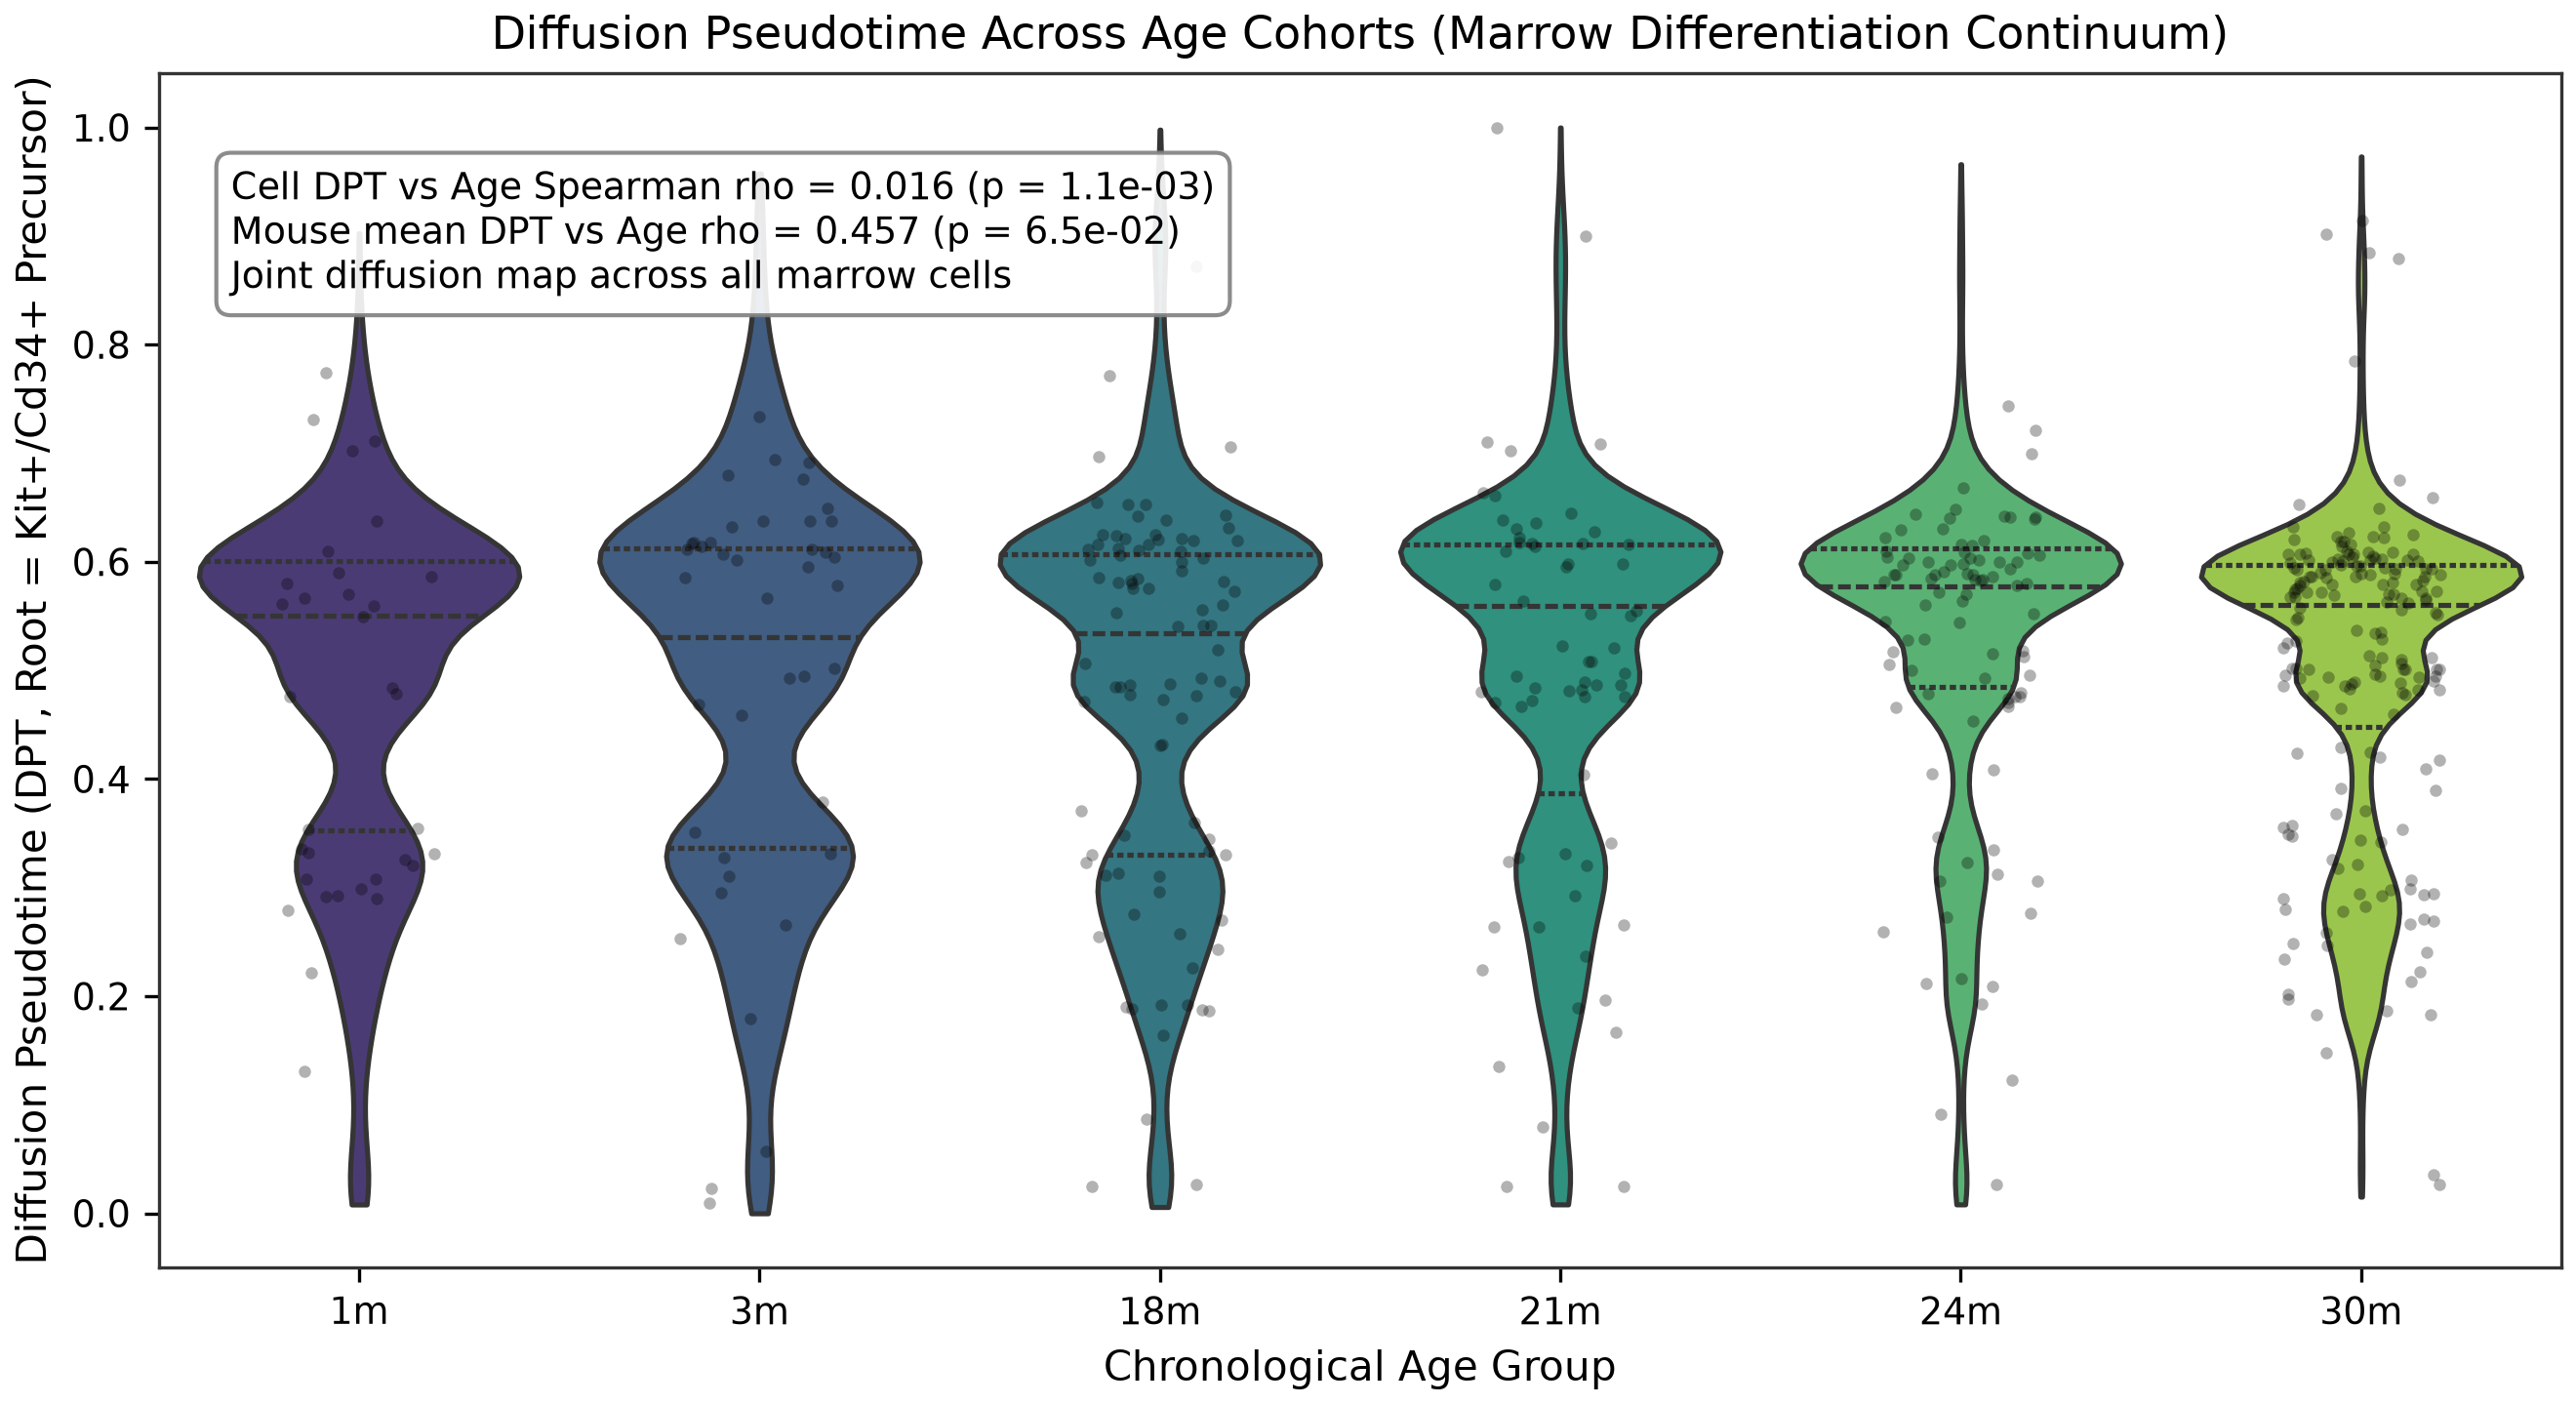
Diffusion pseudotime versus age

Only two age groups include both sexes: 3 months and 18 months

Lighter bars show single-sex age groups. The 3-month group has 5 male and 2 female mice; the 18-month group has 2 male and 2 female. The 1-month, 24-month, and 30-month groups are male-only and the 21-month group is female-only, so sex and age cannot be separated across the full design; the 3m vs 18m contrast is the only comparison with replication in both arms.

Chapter 3

261 direction-specific gene entries across 257 unique genes: 167 entries up, 94 down.

A program is the set of genes that significantly change with age in one cell type. The matrix below describes overlap among significant lists, which alone cannot establish whether the underlying biology is shared or private.

Upregulated entries outnumber downregulated entries across nearly all eligible units

Stacked bars show genes upregulated (vermillion) versus downregulated (blue-grey) with age. Zero-DE units appear as empty tracks.

Significant gene lists overlap little: 261 direction-specific entries across 257 unique genes

Top 40 genes ranked by recurrence across the 17 eligible units. Filled dots show program membership; color indicates direction (vermillion up, blue-grey down). Gene Ccl2 recurs in 2 of the 17 eligible units; gene Spp1 recurs in 2 of the 17 eligible units. Non-overlap of significant lists can reflect power and detection differences as well as biology, so it is not proof of cell-type-private aging.

Housekeeping guard: Ribosomal and mitochondrial transcript inflation

Ribosomal (Rpl/Rps) and mitochondrial (mt-) genes represent a large fraction of raw single-cell sequencing reads. Across the 17 units, housekeeping genes account for 1.7% of background genes and make up as much as 10% of one unit's program (kidney fenestrated cell). These genes are monitored rather than filtered out of the reported programs; a high fraction is a composition caveat, not automatic evidence of an artifact.

Chapter 4

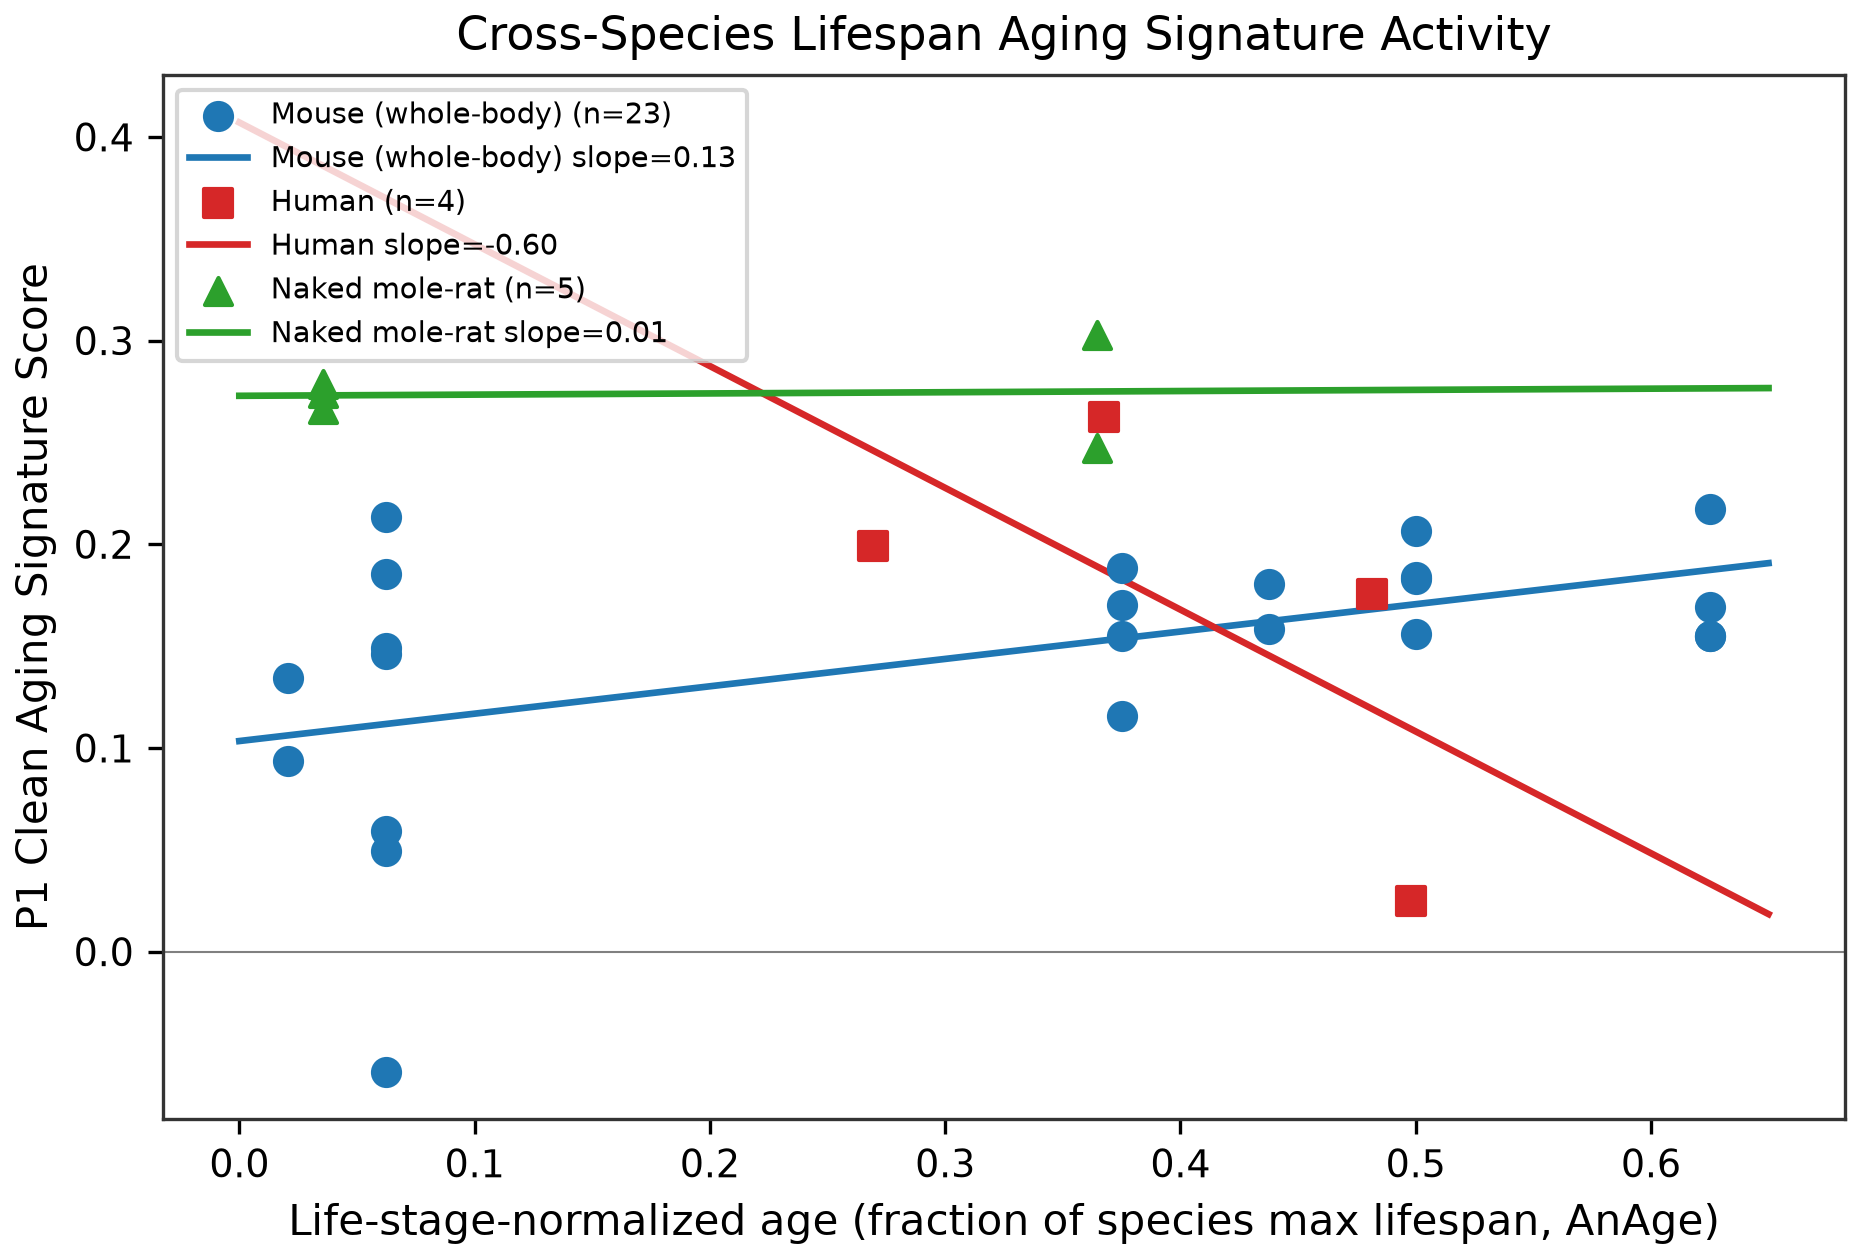
Mouse scores rise in a partly in-sample analysis. Five naked mole-rats are inconclusive. Human whole-cohort summaries show no supported rise.

Each animal is scored by how strongly its cells express the mouse aging program. Scores and slopes are estimated separately within each cohort, not on a common cross-species effect scale.

Within-cohort score trajectories are descriptive; NMR and four-donor human panels are inconclusive

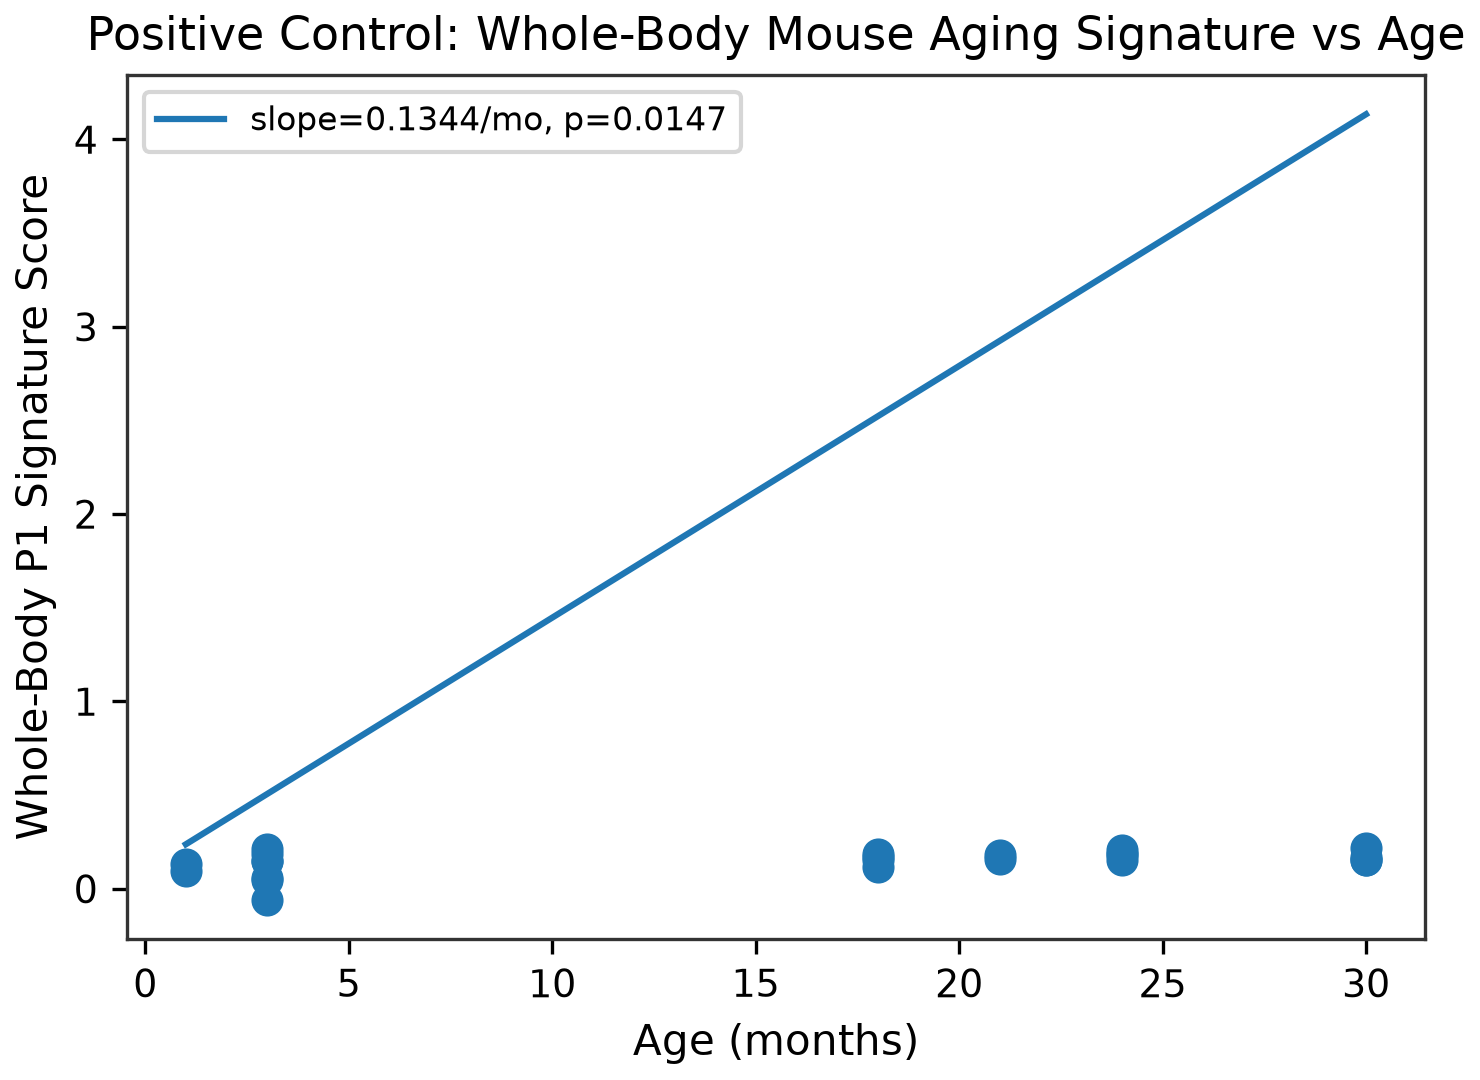
Each panel shows a separate within-cohort descriptive score against life-stage normalized lifespan (0 to 1), not a common-scale cross-species effect. Mouse: β = 0.235, p = 0.008, with the score partly in-sample because the program was derived from the same mouse atlas. NMR: β = 0.017, based on skin only, 31% program coverage, five animals, and two group ages; this does not establish either a rise or stability. Human: n = 4, Tabula Sapiens skin only, below the eligibility floor. Larger human analyses appear in G15 and G16.

NMR equivalence is not established; a biological cross-species difference is not identifiable here

The mouse-minus-NMR interval includes zero, and the cohort-specific scores are not on a common biological scale. The exploratory TOST margin (±0.059) was derived from the observed mouse slope. NMR's interval extends beyond it (p = 0.329), so equivalence is not established.

Tested in 621 donors across 11 cohorts: no supported whole-cohort rise, and one nominal MSSM decline

Whole-donor program score slope per year in 11 public cohorts (brain, kidney, lung), control donors only. MSSM DLPFC has a nominal downward association (p = 0.028), but it is not supported after Benjamini-Hochberg correction across the 11 cohorts (q = 0.311). The other intervals include zero. In the separate 284-donor lifespan atlas (G16), the whole-cortex available-cell-type average has slope +0.00015 per year and p = 0.362; different scoring and cohort composition make this a descriptive comparison, not a direct replication test. Hollow: the interval includes zero, so no direction is claimed. Filled: the nominal interval excludes zero.

Exploratory cell-type estimates vary in direction (score slope per year)

Cohort Cell type Donors Slope per year (x10⁻³) p Eligibility floor

Cell-type p-values are exploratory: hundreds of cell types were tested without multiple-testing correction, so read this as a ranking, not a confirmed hit list. Some glial estimates are directionally consistent with G16, but this does not by itself establish replication. † The MSSM neuron-down estimate is not directionally consistent with EN_L2_3_IT in G16; differences in scoring, cohorts, and normalization preclude declaring the discrepancy resolved.

Chronological lifespan spans decades: NMR tested span represents early-middle age

Linear scale of maximum recorded lifespans (AnAge Build 14). Shaded zones show tested biological spans (NMR tested to 11.3y of 31y max).

This explorer includes single-cell aging comparisons for 3 of 4,141 species with measured longevity

Each dot is a species with recorded adult mass: body mass against maximum recorded lifespan (AnAge). Blue: mammals. Colored and labeled: the three species included in this explorer's single-cell aging comparisons. Other species are not included here; their dots do not indicate whether public single-cell aging data exist elsewhere.

Species Class Max longevity (yrs) Adult mass (kg) Included in this explorer

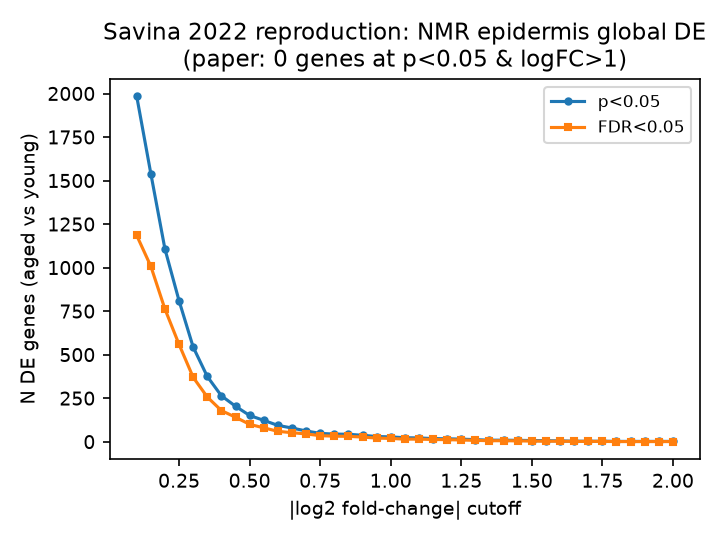
Savina re-analysis: converted natural-log cutoff gives 9 nominal and 6 FDR DE genes

Savina et al. 2022 (Aging) reported zero global DE genes between young and aged naked mole-rat epidermis at their stated rule. If the stated cutoff is interpreted in natural-log units and converted to absolute log2FC 1.45, we find 9 genes at nominal p < 0.05 and 6 at FDR < 0.05. Using the literal absolute log2FC cutoff 1.0 gives 29 nominal genes. A units mismatch is one possible explanation, not an established cause. These are cell-level Wilcoxon tests on five animals, not animal-replicated DE, and they do not establish overall age-related stability. Additional caveats: Igfbp3, the paper's key gene, is absent from the GEO count file and could not be checked; our QC retained 10,251 cells vs the paper's 10,232.

Chapter 5

Detectable effects depend on donor count, age spread, and biological dispersion.

This illustrative grid shows modeled minimum detectable effects, not guaranteed power or a study design that is certain to work. The lifespan atlas then provides a complementary human analysis.

Illustrative detectable-effect grid: more donors and broader age spread can reduce detectable effect sizes

Low Biological Dispersion (0.1)

Medium Biological Dispersion (0.2)

High Biological Dispersion (0.4)

Donors: 4
Age SD: 8 y
Dispersion: 0.1
Min Detectable 30y log₂FC: 1.474
LOW-POWERED

Each panel varies donors (across) and donor-age SD in years (up). Dark tiles indicate larger modeled minimum detectable effects; light tiles indicate smaller ones. Outlined tiles meet the human eligibility floor (at least 6 donors, donor-age SD at least 12 years), which is an analysis threshold and not evidence of adequate power. Tap any tile to update the readout. Mark (✕) shows Tabula Sapiens skin: 4 donors, age SD 8 years, dispersion 0.1, modeled minimum detectable 30-year log2FC 1.474. These illustrative values are not guarantees of detection.

Across 284 donors, seven cell types have same-direction nominal signals in both normalization schemes

In 284 control donors aged 0.2 to 97 years, seven of 27 prefrontal-cortex cell types show the same score direction under both normalization schemes. Solid dots mark these nominal signals; hollow dots claim no direction. The cortex-wide average detects no rise (p = 0.362), but averages different numbers of cell types across donors and is descriptive only.

How to read the cell-type evidence

Large dots and intervals use sum-count pseudobulk; small dots use counts per million (CPM). Solid means same-direction nominal p < 0.05 in both schemes, not uniform robustness. Six of seven also have BH q < 0.05 in both. Adaptive does not (CPM q = 0.092) and is not significant in adults only (p = 0.127). Hover or tap a row for both q values and the adults-only result.

Donors with zero cells of a type are excluded from that row. Missing cell types are not biological zeros. Intervals that include zero do not establish neuronal flatness or equivalence. Control means no psychiatric or neurological diagnosis; common medical comorbidities remain.

Names: EN and IN are excitatory and inhibitory neurons; Astro astrocyte; Oligo oligodendrocyte; OPC oligodendrocyte precursor; Micro microglia; PVM perivascular macrophage; PC pericyte; Endo endothelial; SMC smooth muscle; VLMC vascular leptomeningeal cell; Adaptive adaptive immune.

What would improve human inference?

In the illustrative G13 grid, donor-age SD 12 years and dispersion 0.1 give a minimum detectable 30-year log2FC of 0.491 at 16 donors. At dispersion 0.2, the grid gives a comparable value of 0.521 at 16 donors and SD 16 years. At dispersion 0.4, it gives 0.556 at 50 donors and SD 12 years. These are modeled detectable effects, not guaranteed designs. The DLPFC Lifespan Atlas in G16 is a complementary dataset with 284 donors and age SD 24, not validation of the grid or a universal design.