Abstract
Autophagy is an attractive but difficult target for computational screening because the observable biological signal sits several steps downstream of small-molecule binding, and perturbational transcriptomic readouts frequently confound pathway-specific modulation with generic stress responses. This report systematically benchmarks multiple formulations of the task, including full transcriptome regression, context-aware binary classification, structure-only binary classification, and activator-versus-inhibitor direction prediction across the LINCS L1000, HAMDB, and ChEMBL datasets.
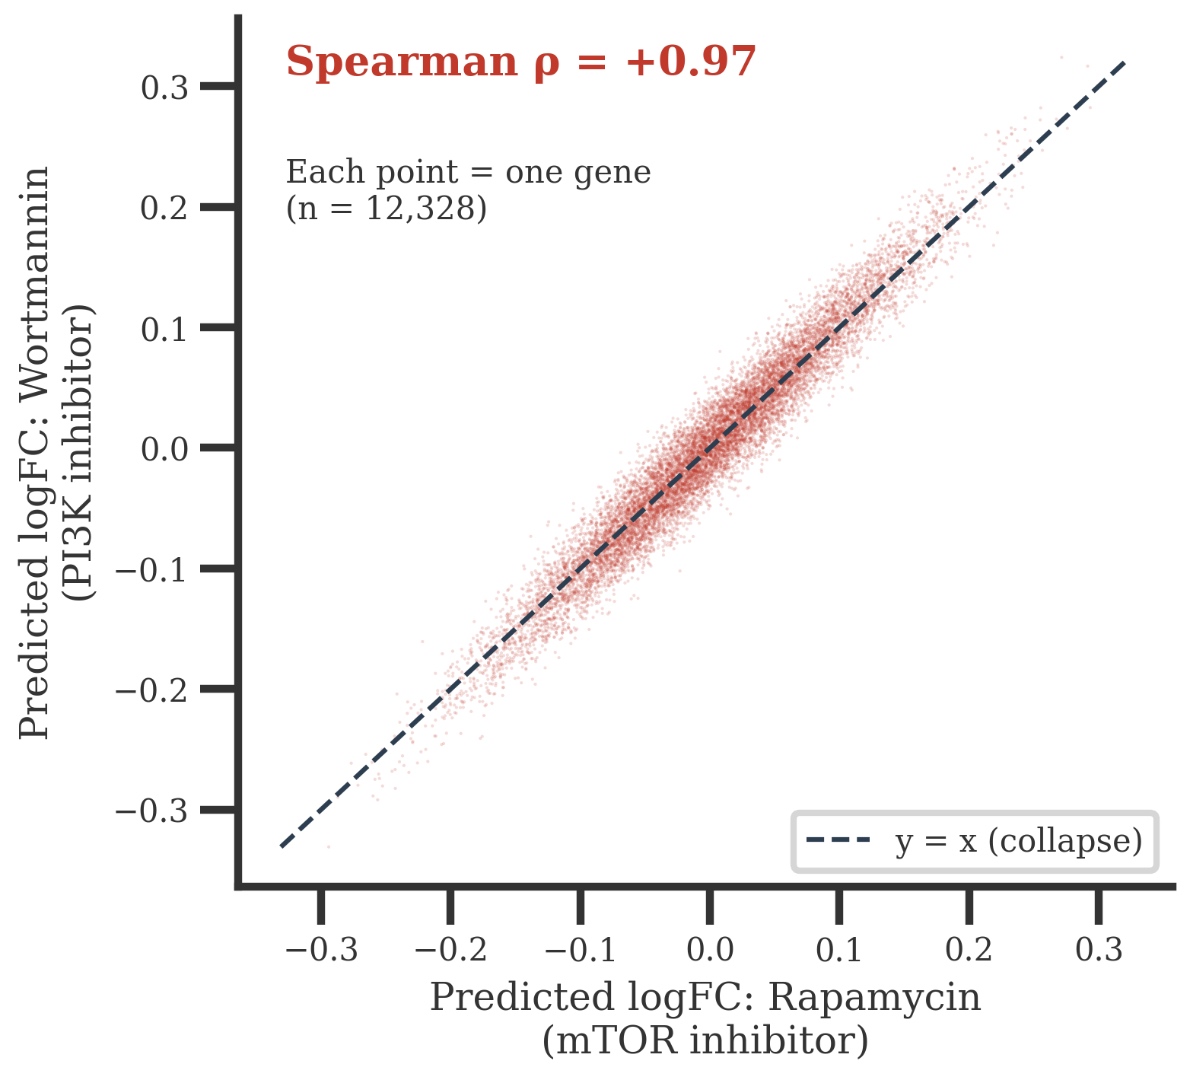
The initial finding was a critical failure mode: a Uni-Mol-based neural network model collapsed on canonical biological controls, predicting Rapamycin and Wortmannin with a Spearman correlation of ρ = +0.97 across 12,328 genes (visible as an almost perfect y = x scatter in Figure 1). That behavior demonstrates that the model learned an invariant "mean stress" vector rather than separating opposing biological activity.
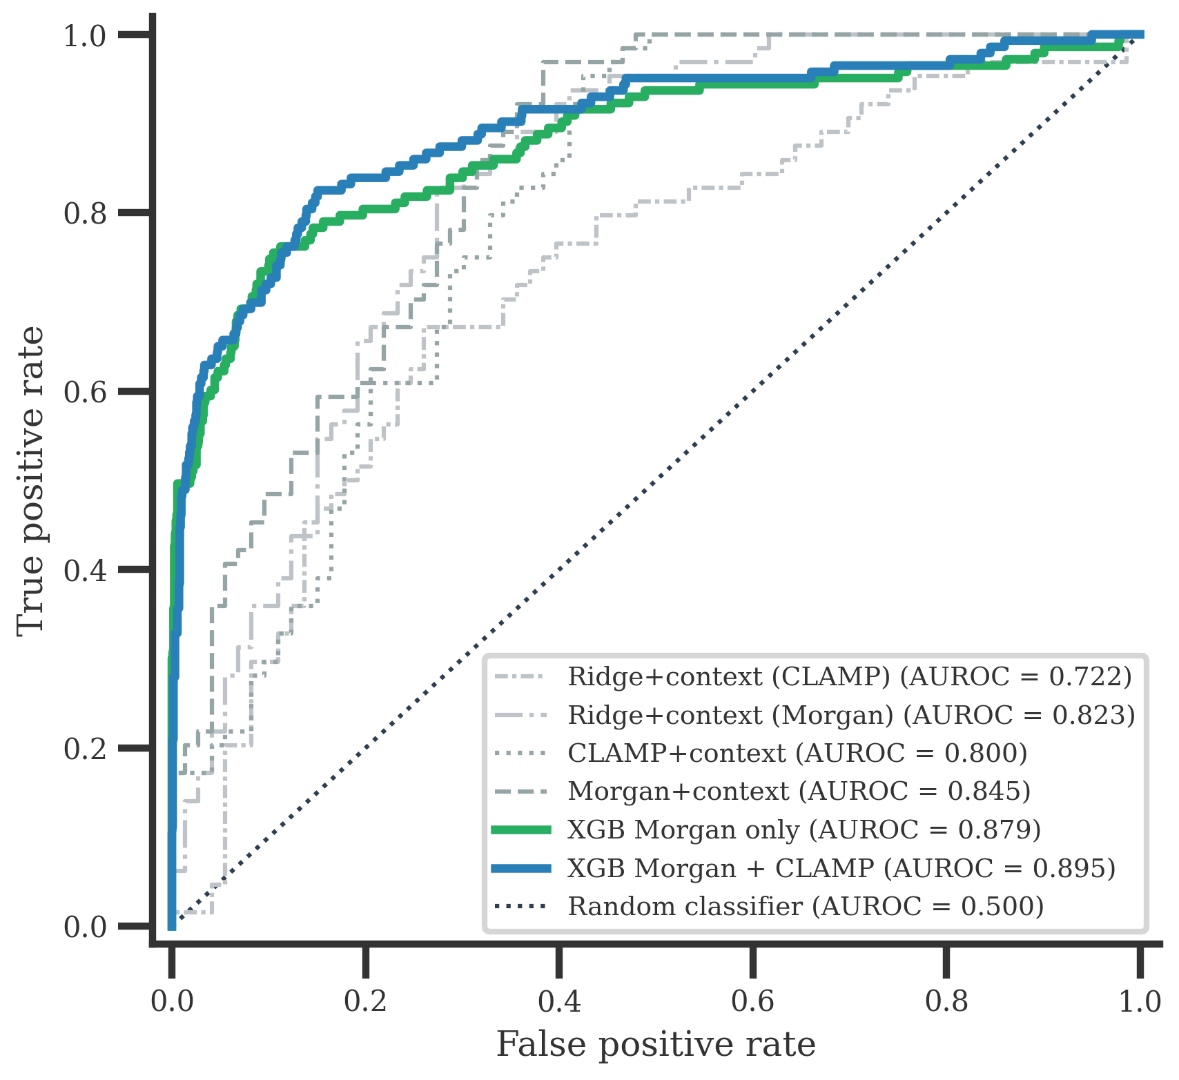
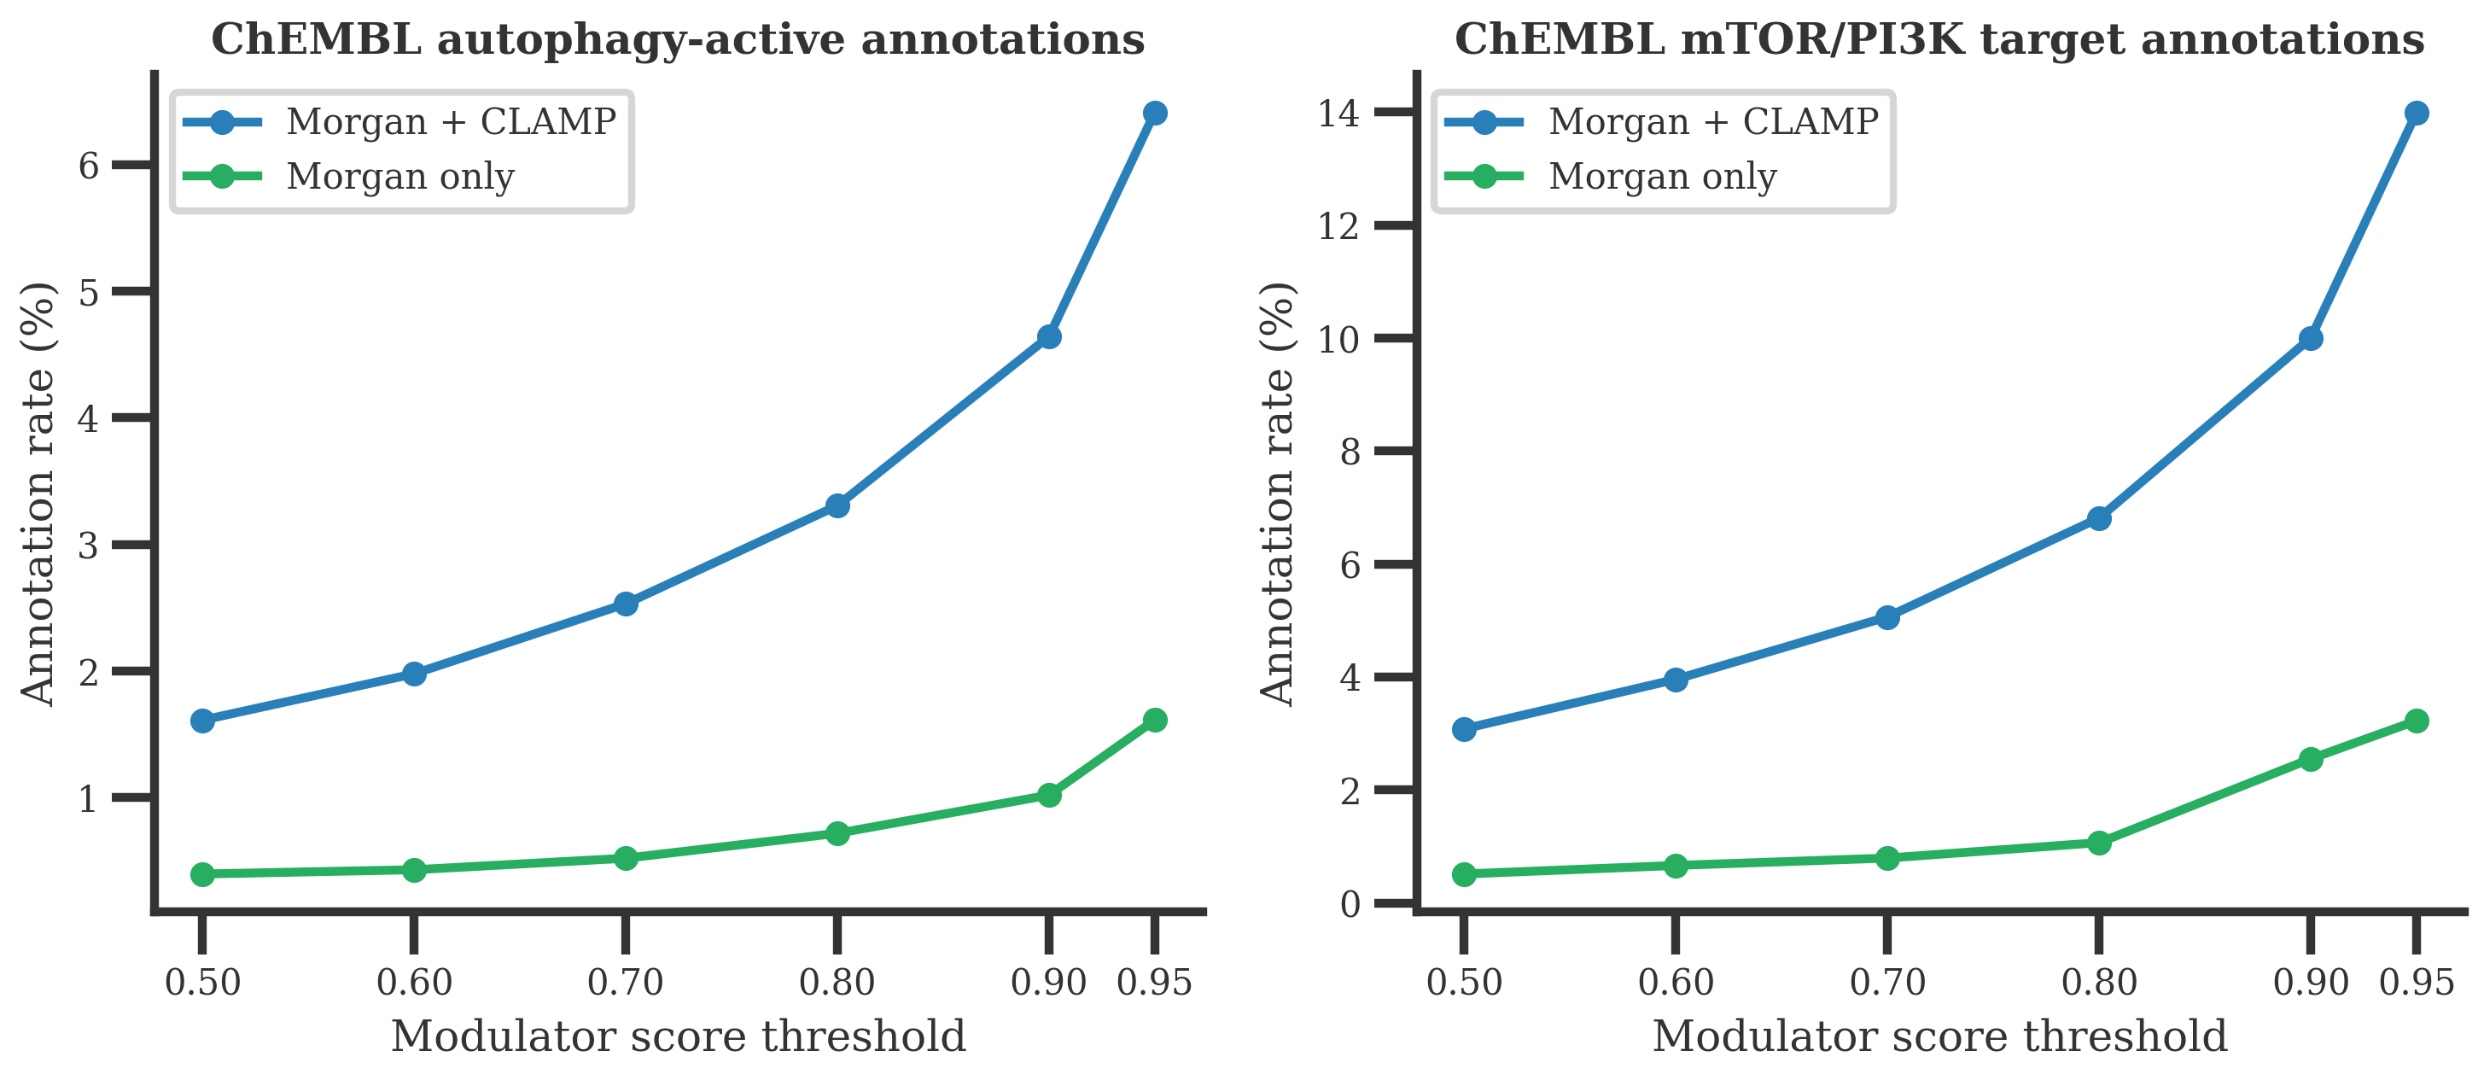
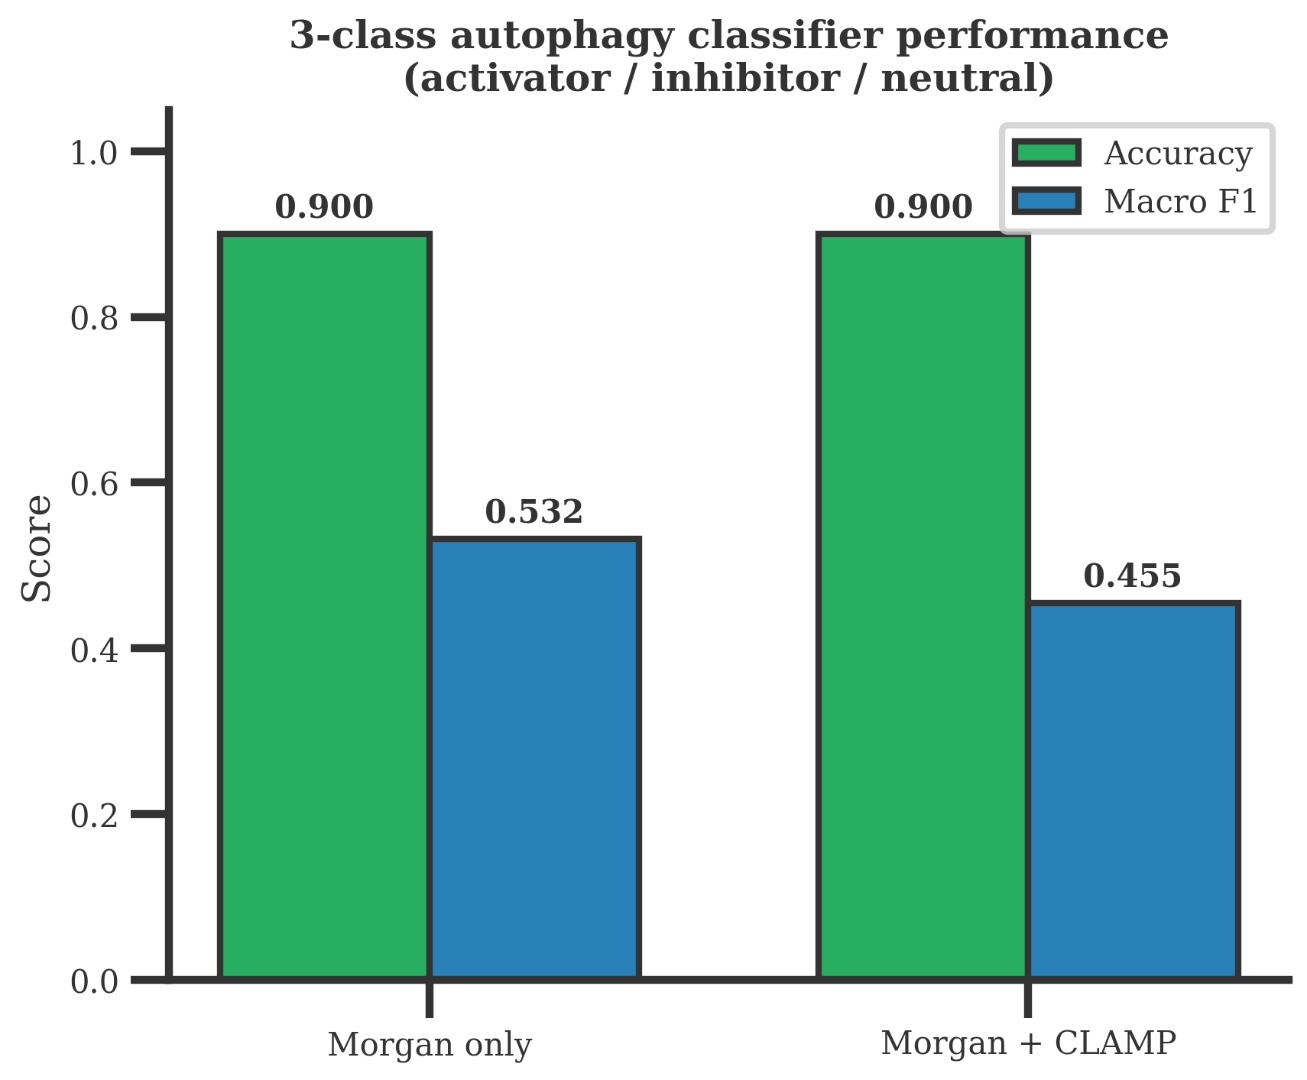
Reframing the problem as binary modulator classification yielded robust, reproducible performance: structure-only XGBoost with Morgan fingerprints achieved 0.879 AUROC (0.895 with CLAMP), and external scoring across 99,434 ChEMBL compounds enriched 9-fold for verified autophagy-active targets. In contrast, activator-versus-inhibitor direction prediction remained weak (macro F1 0.532), driven largely by the dominant neutral class and data sparsity in known inhibitors.
1. Introduction
Autophagy is a conserved cellular recycling and quality-control program with fundamental roles in aging, neurodegeneration, oncogenesis, and metabolic adaptation. The primary challenge in computational longevity screening is establishing whether chemical structures can reliably predict functional autophagy modulation rather than general cytotoxicity or non-specific transcriptional noise.
A common approach in recent machine learning literature has been learning end-to-end structure-to-transcriptome mappings on datasets such as LINCS L1000, subsequently deriving autophagy scores from predicted gene expression. However, transcriptomic profiles in large public repositories are heavily shaped by cell-line specificity, compound dosage, exposure kinetics, batch effects, and compensatory transcription programs.
This study was structured as a rigorous empirical audit to determine which problem formulation reliably generalizes: continuous transcriptome regression, signature matching, binary modulator classification, or multi-class direction prediction.
2. Data and Modeling Setup
2.1 Data Resources
We integrated three complementary data environments:
| Resource | Dataset Scope | Role in Study |
|---|---|---|
| LINCS L1000 Phase I | 471,660 Level 5 signatures; 20,315 compounds; 76 cell lines | Transcriptome prediction, context features, biological validation |
| HAMDB | 841 compounds with SMILES (514 activators, 132 inhibitors, 167 neutral) | Ground-truth positive labels and direction annotations |
| Autophagy Gene Sets | 199-gene pathway set + 25-gene flux-contrastive core set | Regression targets and contrastive signature filtering |
| ChEMBL Screen | 99,434 neutral small-molecule structures | Out-of-training prioritization and orthogonal assay validation |
2.2 Molecular Representations
We evaluated three primary representations: (1) 2,048-bit Morgan circular fingerprints (radius 2), (2) CLAMP (768-dimensional contrastive molecule-bioassay embeddings), and (3) Uni-Mol 3D representations.
2.3 Validation Methodology
To prevent artificial inflation from scaffold leakage, all evaluations utilized Murcko scaffold-aware cross-validation and held-out biological controls (e.g., Rapamycin, Wortmannin, Chloroquine) rather than random naive splits.
3. Results & Empirical Analysis
3.1 Transcriptome Regression Collapses on Biological Controls
When evaluating the neural network structure-to-transcriptome regression model, we tested opposing functional controls: Rapamycin (canonical autophagy activator via mTOR inhibition) and Wortmannin (canonical inhibitor via PI3K blockade). Biologically, these compounds induce strongly divergent transcriptional states.
Instead, the regression model predicted their expression profiles with a Spearman correlation of ρ = +0.97 across 12,328 genes. As shown in Figure 1, the model output identical high-dimensional predictions along the identity line, having collapsed to a generic cellular stress vector.
3.2 Binary Classification Establishes a Robust Baseline
Reframing the objective from high-dimensional regression to binary modulator classification (HAMDB active modulators vs. scaffold-sampled background molecules) restored clear discriminative performance across scaffold-aware test splits.
| Architecture | Features | Setting | AUROC | Summary Note |
|---|---|---|---|---|
| Ridge Regression | CLAMP + context | Context-Aware | 0.722 | Linear baseline |
| Ridge Regression | Morgan + context | Context-Aware | 0.823 | Linear fingerprint baseline |
| MLP Neural Net | CLAMP + context | Context-Aware | 0.800 | Non-linear embedding |
| MLP Neural Net | Morgan + context | Context-Aware | 0.845 | Best context-aware model |
| XGBoost | Morgan Only | Structure-Only | 0.879 | Structure-only baseline |
| XGBoost | Morgan + CLAMP | Structure-Only | 0.895 | Best overall classifier |
3.3 External Validation on 99k ChEMBL Small Molecules
To evaluate out-of-distribution utility, we scored 99,434 neutral ChEMBL small molecules with the binary classifier and computed the enrichment of compounds with documented bioactivity in orthogonal autophagy and mTOR/PI3K assays.
| Score Threshold | Compounds (N) | % of Library | Autophagy Active % | mTOR / PI3K % | Enrichment Factor |
|---|---|---|---|---|---|
| ≥ 0.50 | 21,897 | 22.0% | 0.40% | 0.51% | 1.0× |
| ≥ 0.70 | 9,201 | 9.3% | 0.52% | 0.79% | 1.6× |
| ≥ 0.90 | 980 | 1.0% | 1.02% | 2.55% | 5.2× |
| ≥ 0.95 | 310 | 0.31% | 1.61% | 3.23% | 9.0× |
3.4 Activator-versus-Inhibitor Direction Prediction Fails
In contrast to binary screening, structure-based classification of activator versus inhibitor direction failed to demonstrate robust generalization. Flat 3-class models reached a deceptive accuracy of 0.900, but exhibited a macro F1 of only 0.532. As shown in Figure 4, headline accuracy was driven entirely by predicting the dominant neutral class.
4. Key Takeaways & Recommendations
- Transcriptome regression is an unreliable surrogate: High-dimensional mRNA readouts capture non-specific cellular stress responses, masking pathway-specific autophagy dynamics.
- Binary classification with simple fingerprints works: 2,048-bit Morgan circular fingerprints paired with gradient boosting deliver a reliable, cost-effective initial screen (0.858–0.895 AUROC).
- Do not trust structure-only direction predictions: Direction models should not be used to prioritize compounds until substantially larger, scaffold-diverse inhibitor training libraries are constructed.
- Prioritize direct kinetic assays: Direct orthogonal endpoints (e.g., LC3-II turnover, SQSTM1 degradation, lysosomal flux assays) are essential to distinguish authentic modulators from generic stress inducers.
5. Reproducibility & Repository Architecture
The complete benchmarking pipeline, trained weights, and analysis scripts are tracked in the study repository:
| Script / Artifact | Function |
|---|---|
| curate_autophagy_genes.py | Curates 199-gene autophagy reference set from KEGG / GO pathways. |
| hamdb_binary_classifier_xgb.py | Trains XGBoost binary classifier comparing CLAMP vs. Morgan fingerprints. |
| extract_autophagy_signatures_v2.py | Generates cell-line contrastive signatures with background subtraction. |
| binary_morgan_only_xgb.pkl | Serialized XGBoost binary model for fast structural screening (AUROC 0.858). |